Professional astronomers refer to this as ‘Lucky Imaging’, a term that I dislike.
The Collins Dictionary says that the adjective ‘Lucky’ refers to something that was ‘good or successful, and that it happened by chance and not as a result of planning or preparation.’ This is what I object to, because so-called ‘Lucky Imaging’ is the result of planning, but it does rely on ‘chance’ or probability! It is the probabilistic element that leads me to describe the process as Stochastic Imaging, because it depends on Stochastic processes, which involve change occurring randomly over time.
Sir Fred Hoyle FRS, famous for the Steady State theory of Cosmology, but more importantly, for his leadership, research and insight into stellar nucleosynthesis became the Plumian Professor of Astronomy and Experimental Philosophy at Cambridge (UK). He was the founding director of the Institute of Theoretical Astronomy; which was subsequently renamed The Institute of Astronomy.
The University of Cambridge Institute of Astronomy is actively involved in research on ‘Lucky Imaging’ and has a section on their website describing some of the substantial contributions to the subject by amateur astronomers. Click HERE to see it.
This is important for imaging astronomical objects such as the Sun, Moon and planets with ground-based equipment.
As every observer knows, the ‘seeing’ which depends on atmospheric turbulence, affects how well one can observe the object. Under conditions of very bad seeing, the atmosphere seems to ‘boil’ and the object wobbles about so severely that it is virtually impossible to make a worthwhile observation. However, when seeing conditions are somewhat better; again, as every observer knows, whilst the object still wobbles due to the atmospheric movements, there are rare, fleeting moments of perfect seeing when the observer can see the structure of the object in crystal clarity. Then, the moment is gone, and the observer keeps looking, waiting for the next moment of clarity.
Part of a data set on Venus, played back in slow motion to show the effects of poor seeing

The quality of the seeing, can be ranked on various scales, such as the Antoniadi scale, which was invented by Eugène Antoniadi, a Greek astronomer (1870 to 1944). There are other scales of seeing, but the Antoniadi scale is particularly valuable for planetary observation records.
The Antoniadi Scale of Seeing.
(I.) Perfect seeing, without a quiver.
(II.) Slight quivering of the image with moments of calm lasting several seconds.
(III.) Moderate seeing with larger air tremors that blur the image.
(IV.) Poor seeing, constant troublesome undulations of the image.
(V.) Very bad seeing, hardly stable enough to allow a rough sketch to be made.
Since the advent of electronic imaging devices, it has been possible to image the Sun, Moon and Planets in a totally different way to the imaging that was done using film cameras. Electronic cameras such as CCD cameras and latterly CMOS cameras allow for the rapid acquisition of large numbers of images over a short period of time. With some configurations of camera and telescope, hundreds of frames per second can be captured, each frame effectively freezing the seeing at the moment of time that it was captured.
Turbulence of the air arises from the fact that air packets or cells of different temperature and or humidity refract light to different extents. Shear forces due to winds such as the Jet stream also move the turbulence across the telescope’s line of sight. The above-mentioned variations change the refractive index of the air cells. This changes the apparent positions of tiny regions of the sky (or object) being imaged and causes the image to wobble and shimmer. When light passes from one cell of air to another of differing temperature or humidity, the light is refracted through an angle that causes the apparent movement that is observed as seeing. This is a random process and is described statistically using the Kolmogorov-Tatarski model of turbulence.
Turbulence has several components:
High altitude turbulence associated with the Jet stream.
Geographical turbulence that extends from a few hundred metres to several kilometres. The features of the landscape shape the temperature and humidity of the overlying atmosphere.
Surface turbulence extends from the ground up to several hundred metres and is cause by convection currents arising from a variety of surfaces such as concrete roads, rooftops, vegetation, water etc. This component is responsible for about 50% of the optical distortion.
Instrument turbulence that arises from convection currents inside the telescope itself, the observatory structure and the people in the observatory. Hence the importance of opening the observatory to allow it to cool and allowing the telescope itself to cool down to ambient temperatures before use and never standing underneath the front of the telescope or placing heat generating devices such as computers under the front of the telescope during observing or imaging sessions.
Minimising the effects of Seeing distortions.
This is where the stochastic elements of planetary imaging are used. As mentioned previously; all observers know that by looking carefully at the observed object through the eyepiece, there will be brief moments when the seeing allows the observer to see the detailed structure of the observed object. The better the seeing, the more frequent and the longer duration will these moments of clarity be.
It follows that if one captures high speed images for a long enough period, some of those images will be of much higher quality than others. Indeed, some of the parts of individual images will be of better quality than the rest of the image.
So, the first rule is to capture as many images (or frames in a SER file or an old fashioned AVI file) as you can in a ‘reasonable’ period of time. For some objects, the ‘reasonable’ period of time is quite short. For example, Jupiter, which has a rotation period of 10 hours, rotates so quickly that before very long, rotation will affect the image when the images are combined. Estimates vary, but a reasonable rule is to capture frames of Jupiter for less than 3 minutes.
The captured images (or rather some of them) will be combined or stacked into a single image. This involves accurately registering (i.e placing them exactly one on top of the other) of the images (or even parts of images) before the summing into a stacked image occurs.
Every image has two components; Signal and Noise. Signal is the structure that should be present in every replicate image and noise (which itself has several components) is largely random and thus is different in every image. Noise can be manifest as random small spots in the image due to the electronics of readout and gain etc.
As images are summed into a stack, the signal to noise ratio S/N increases as the noise becomes averaged out over many frames. Increased S/N allows an image to be sharpened to reveal more detail. It can be seen that the S/N as a function of number of stacked images follows the law of diminishing returns.

Thus, for example, whilst there is a 10-fold increase in S/N when one stacks 100 images, there is only a 31.6-fold increase when one stacks 1000 images and a 44.7-fold increase in S/N if one stacks 2000 images. Indeed, stacking 5,000 images only increases the S/N 70.7-fold. So, why capture so many images, if detail can be adequately extracted from fewer (but still a large number) images? In fact, why capture 10,000 or even 20,000 images as we frequently do?
Mathematically, there is no distinction between fine detail and noise. If you try to sharpen an individual frame, this becomes evident as the noise becomes accentuated and the quality of the image decreases. If, however, you try to sharpen a stack of images, the noise has been averaged away and this time, sharpening will accentuate the fine detail which is what is intended. As seen above, the S/N ratio increases as the square root of the number of images stacked.
The answer to the question of why we capture sometimes incredibly large numbers of images lies in the fact that we can rank images according to their quality or sharpness. This ranking can be done automatically by computers and a number of algorithms have been developed to do this. One of the several ways of doing this is to look at a sharp and a blurred image of the same object. In the blurred image, the differences in brightness between adjacent pixels is small, as changes occur gradually across a blurred image. On the other hand, with a sharp image, the differences between adjacent pixels is large, because there are rapid changes in brightness across boundaries within the image. Doing something as simple as summing the difference in brightness of adjacent pixels across the whole image will show a larger sum for the sharp image than it will for the blurred image. This process could be done for all of the images in a data set and the images could be ranked according to their calculated sharpness, from least sharp to most sharp. Then, we could throw away the least sharp images and only stack the sharper images.
AstroDMx Capture for Linux capturing data on the 17.7% crescent Venus on a laptop running Voyager Linux

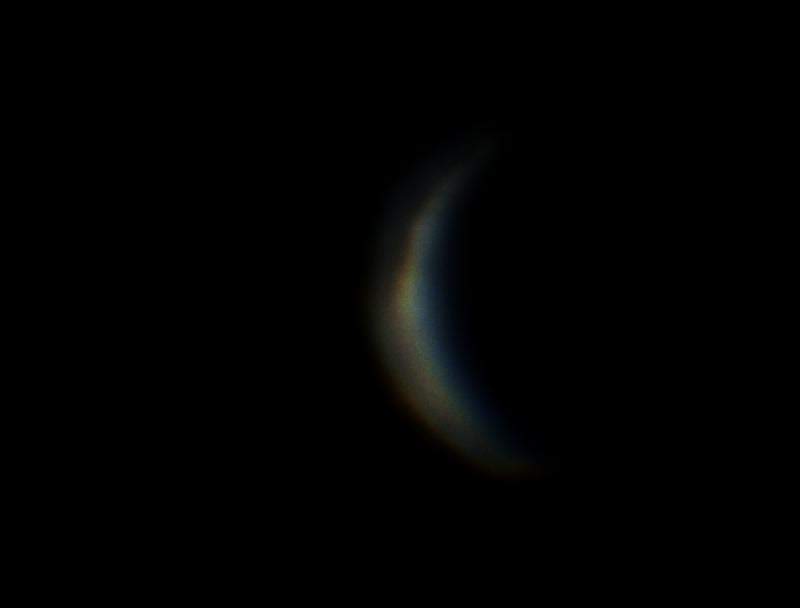
A relatively good individual frame in the Venus data set

A surface plot of pixel brightness

Horizontally flipped

A relatively poor individual frame in the Venus data set
A surface plot of pixel brightness
 Horizontally flipped

The result of stacking the best 50% of a 5,000-frame SER file without RGB channels alignment

The results of stacking the same data as those in the previous image but with RGB channels alignment.

Processing of the final stacked image involved wavelet processing in Registax 6 and post processing in the Gimp 2.10.
Final processed image of the 17.6% crescent Venus

Surface plot of the final image
 Horizontally flipped

The reason for capturing a huge number of images is that within the data set, there will be a number of good images captured during brief moments of good seeing. The more images we capture, the more good images the data set will contain. We can then afford to throw away many, or even most of the images in the data set and stack just the remaining images of higher quality. We will stack sufficient images to take advantage of the relationship between S/N and number of images stacked. The number of images we throw away is thus as important in a sense, as the number of images we stack.
This is not luck, it was planned, understanding the probabilistic nature of the whole process, by capturing large numbers of replicate images, ranking them on quality and stacking the best. I suppose that if we get a good result after the event, we could be described as having been lucky, and the process could be described as ‘lucky imaging’. However, this is a stochastic process, the outcome of which can vary according to the stochastic processes that have occurred between the light leaving the object to be imaged, passing through the atmosphere with its stochastic turbulence, then the telescope and the final capturing of the images on the sensor. We might be lucky, or we might not, depending on the seeing, but we have been doing Stochastic Imaging!